Capture Overview in TCP Viewer
Capture overview shows the main facts about a capture in one place. Use it to find busy apps, common destinations, traffic spikes, and the protocols using the most data.
It works with a live capture or an opened capture file. During a live capture, the page updates as new packets arrive.
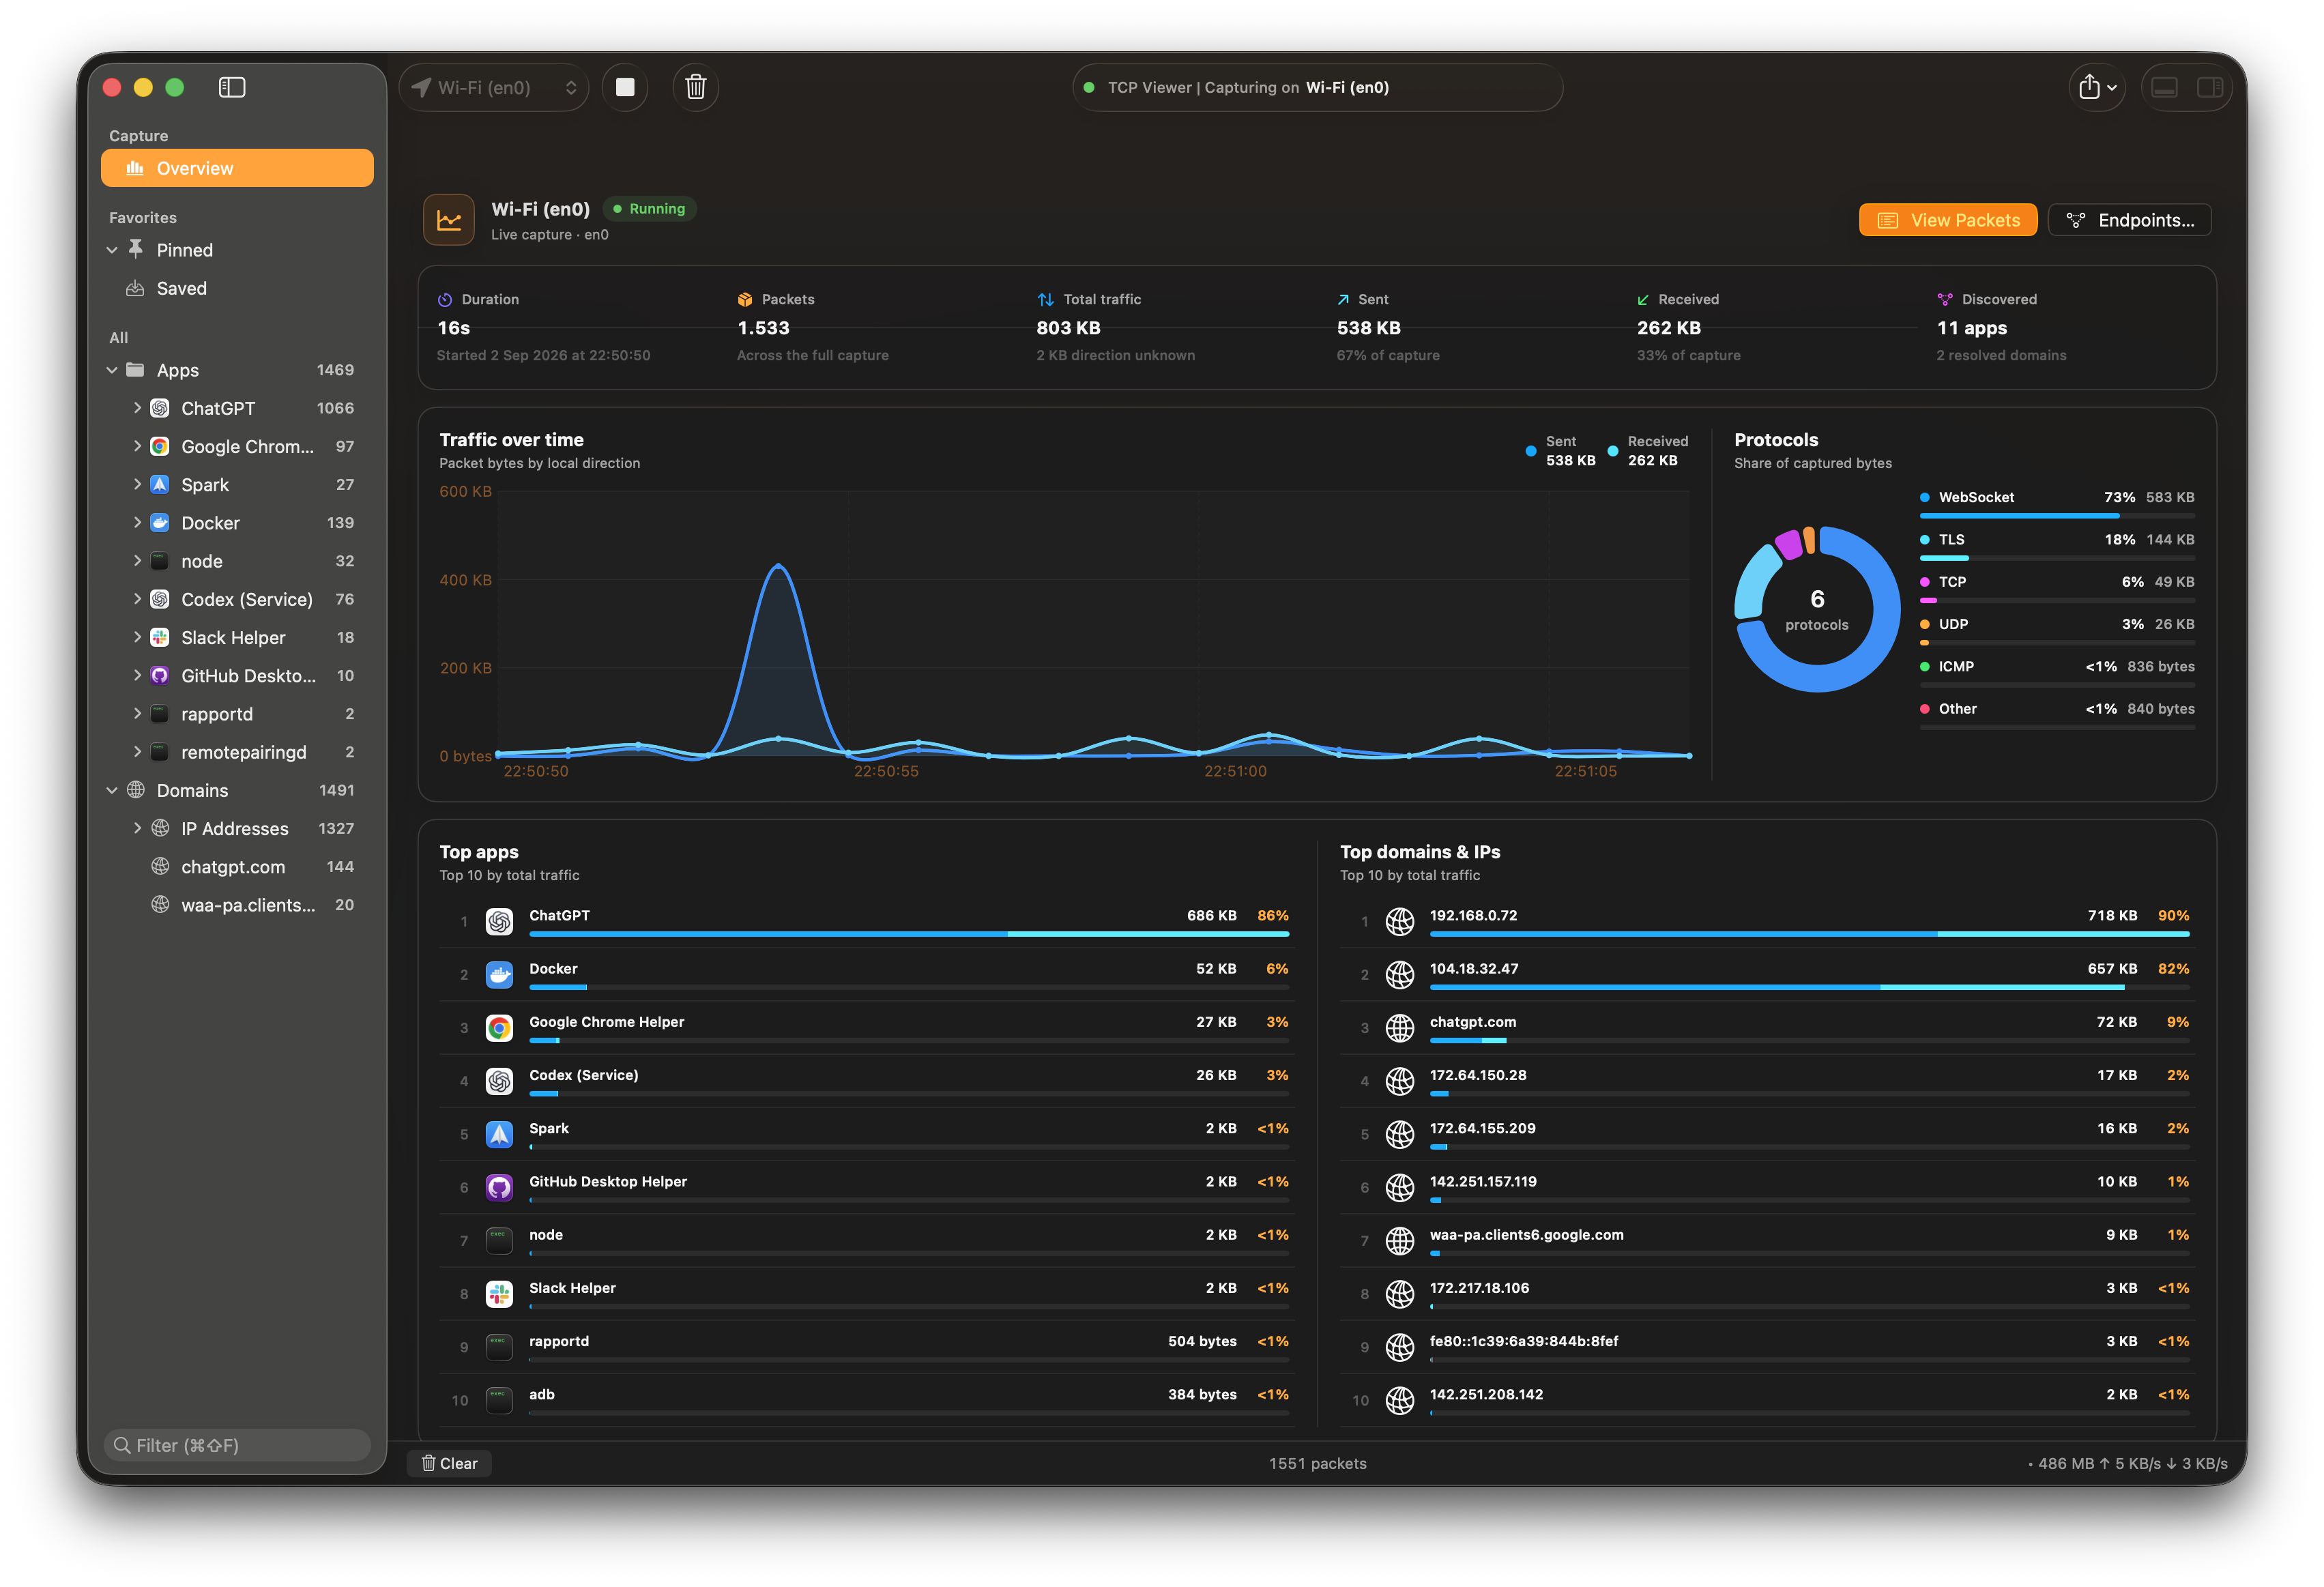
See the full capture before opening individual packets.
1. Benefits
- ✅ Check the packet count and total traffic at a glance.
- ✅ Compare sent and received traffic.
- ✅ See when traffic increased or dropped.
- ✅ Find the protocols using the most data.
- ✅ See the top apps, domains, and IP addresses.
- ✅ Open matching packets or the Endpoints window from the same page.
2. Open Capture overview
- Start a live packet capture or open a capture file.
- Select Overview under Capture in the sidebar.
- Select View Packets to return to the packet table.
- Select Endpoints… to open detailed endpoint totals.
You can also select a row under Top apps or Top domains & IPs. TCP Viewer then opens the packets for that app, domain, or address.
3. Read the summary
The summary at the top shows:
| Item | What it means |
|---|---|
| Duration | Time covered by the capture. |
| Packets | Number of captured packets. |
| Total traffic | Original packet bytes in the capture. |
| Sent | Traffic sent from the Mac. |
| Received | Traffic received by the Mac. |
| Discovered | Apps and resolved domains found in the capture. |
Some packets may not have a clear local direction. TCP Viewer still includes their bytes in Total traffic and marks the direction as unknown.
4. Read the charts and lists
Traffic over time plots sent and received bytes. Use it to spot a burst of traffic and see when it happened.
Protocols shows how much traffic each protocol used. TCP Viewer lists the five largest protocol groups and combines the rest as Other when needed.
Top apps and Top domains & IPs show up to ten rows, ordered by total traffic. Each bar separates sent and received data. Select a row to view its packets in the main table.
5. Read Overview through MCP or the command line
In 1.18.0, use MCP's get_overview_statistics or the CLI's overview get to
read the dashboard data without opening this view. Target a tab or pane by ID
to analyze its complete capture source while leaving your current tab selected.
Overview uses the full source, regardless of the pane's display filters.
See TCP Viewer MCP or Command line
for examples. Use endpoint statistics with scope: displayed when you need
totals for a pane's filtered packets.