
How to Analyze a PCAP File on Mac
Learn how to analyze a PCAP or PCAPNG file with TCP Viewer and quickly find failed, slow, or unexpected network traffic.
 Proxyman TeamJuly 21, 20265 min read
A PCAP file is a saved record of network activity. It shows what a device sent and received during a period of time.
You may get one when an app cannot connect, a page loads slowly, or a server does not reply. A capture can contain thousands of packets, but you do not need to read every row. This guide shows you how to find the useful part with TCP Viewer.
PCAP files may contain private domains, addresses, or messages. Only open and share captures that you are allowed to inspect.
Start with one question
Before opening the file, decide what you want to learn. For example:
- Did the app contact the correct server?
- Did the server reply?
- Why was the request slow?
- Why did the app try again?
Write down any clues you have, such as the time, app name, domain, or server address. These clues will help you remove unrelated traffic.
1. Open the file
Open TCP Viewer and drag the .pcap or .pcapng file into the window. TCP Viewer will show the saved packets in a list.
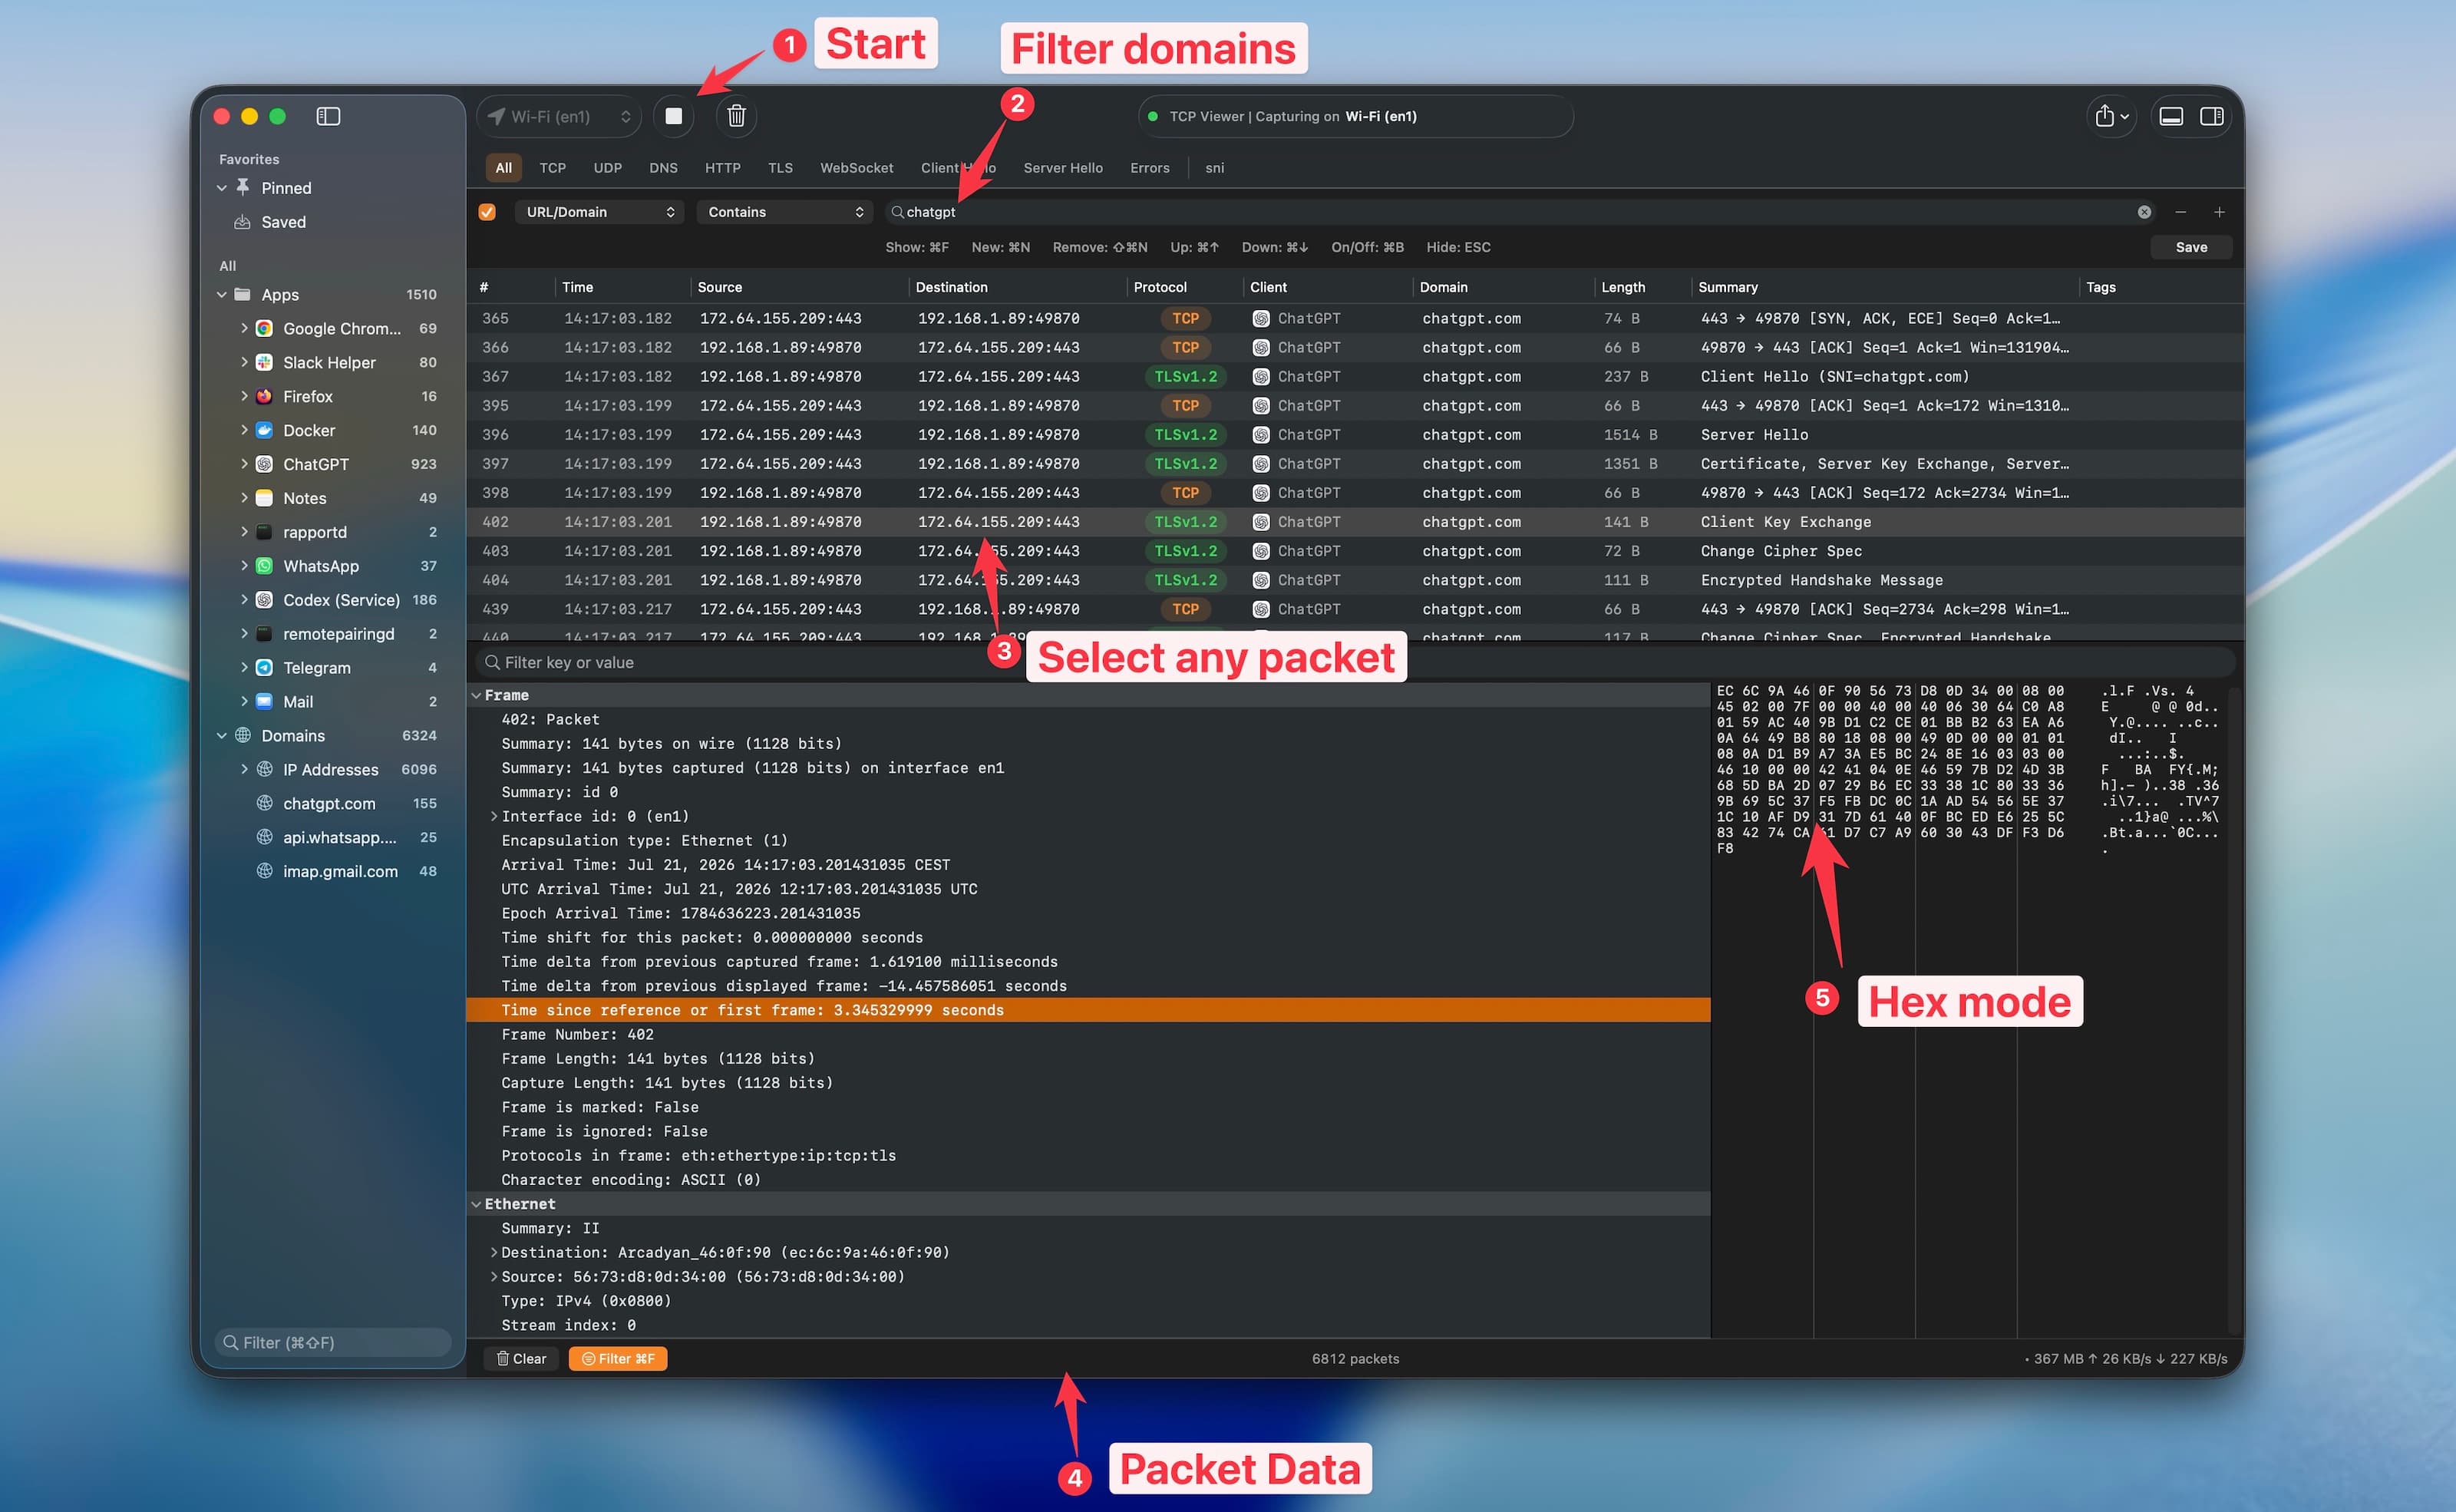
The image shows a live capture, but the same domain filter, packet details, and byte view are available when you open a saved PCAP file.
Each row is one small part of a network conversation. The main columns tell you:
- Time: when it happened
- Source: where it came from
- Destination: where it went
- Protocol: the type of traffic
- Summary: a short description
Think of Source and Destination as the sender and receiver. If your Mac is the source, it sent the packet. If the server is the source, the server sent something back.
2. Remove unrelated traffic
Use the groups on the left side to focus on an app, domain, or IP address. Start with the clue you already know.
For example, if the problem involved api.example.com, select that domain. If the domain is missing, try its known server address instead.
You can also use the buttons above the list:
- DNS shows requests that turn names into server addresses.
- TCP shows steady connections between two sides.
- UDP shows short messages sent without a steady connection.
- HTTP shows readable web requests when available.
- TLS shows protected connections.
Use the filter field for a domain, address, port, or app name. Begin with one filter. If the list is still large, add another rule. Do not make the filter too narrow too early, because you may hide the event that caused the problem.
3. Follow the conversation
Read the important rows from top to bottom. A normal connection often follows this order:
- The app finds the server address.
- The app starts a connection.
- The server answers.
- The two sides exchange data.
- The connection closes.
Look for the point where this story stops or repeats. If the app sends packets but nothing comes back, the visible conversation ended while waiting for the other side. If the same action appears several times, the app may be trying again.
Check the Time column too. A large gap between a request and its reply shows where the user waited.
4. Inspect an important packet
Select a useful row to open its details. Start with the readable field view. It can show the sender, receiver, port, message type, and error information.
You usually do not need the raw byte view. The summary and readable fields are enough for a first investigation.
Do not judge one packet by itself. Compare it with the row before it and the row after it. Network activity makes more sense as a conversation.
Quick checks for common problems
| Problem | What to check |
|---|---|
| Server name not found | Choose DNS. Find the domain and check whether an answer came back. |
| No response | Filter by the server. Compare outgoing packets with incoming replies. |
| Slow request | Find the first request and useful reply. Look for the largest time gap. |
| Repeated attempts | Look for similar rows sent to the same destination several times. |
| Unexpected server | Select the unfamiliar domain or address and check which app used it. |
An unfamiliar address does not automatically mean something is wrong. Apps often contact outside services for sign-in, updates, images, and other features.
Write a short conclusion
Record only what the capture shows. Include the time, app or server, what was sent, whether a reply arrived, and the packet numbers that support your finding.
For example:
At 10:42:16, the app found the address for
api.example.com. It then tried to connect three times, but no reply appears in this capture.
This is more useful than guessing at the cause. Another person can open the same file and check the same packets.
If you share the result, export only the packets needed for the investigation when possible. A smaller file is easier to review and less likely to include unrelated private traffic.
Five-step checklist
- Start with one clear question.
- Open the file in TCP Viewer.
- Filter by app, domain, address, or protocol.
- Follow the packets in time order and inspect the important details.
- Write down what the capture proves.
Try TCP Viewer
Download TCP Viewer for macOS to inspect your next capture, or learn how to capture and read DNS traffic.